Note
Go to the end to download the full example code.
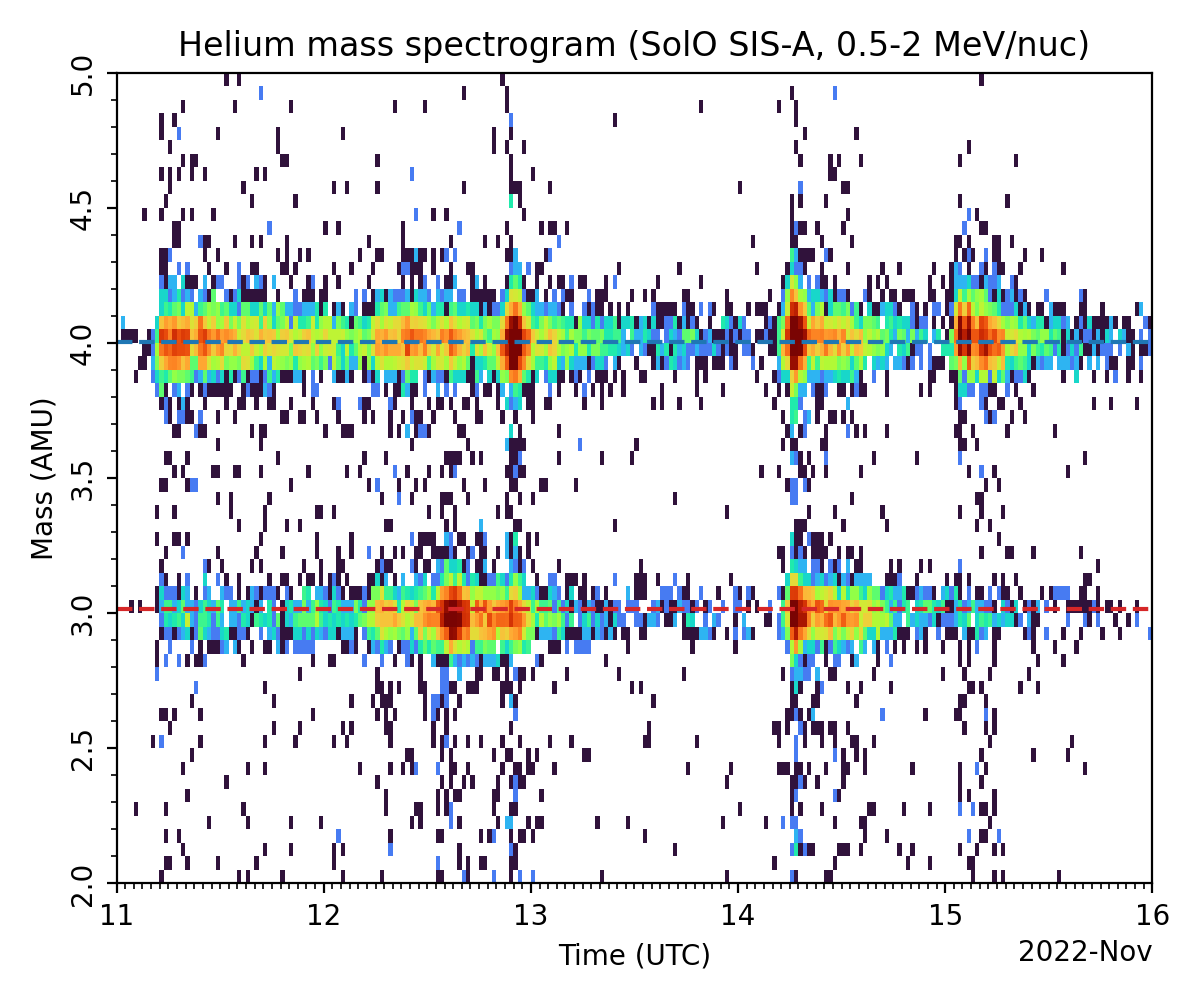
Plot SIS He Mass Spectrogram
In this example, we use solo_sis_loader’s package to plot the He mass spectrogram.
Import Required Modules
from datetime import datetime

import matplotlib.dates as mdates
import matplotlib.pyplot as plt
import sunpy.net.attrs as a
from matplotlib import colors

from solo_sis_loader import SIS_histo
Files Downloaded:   0%|          | 0/6 [00:00<?, ?file/s]


solo_L2_epd-sis-a-hehist_20221112_V01.cdf:   0%|          | 0.00/7.98k [00:00<?, ?B/s]

solo_L2_epd-sis-a-hehist_20221111_V01.cdf:   0%|          | 0.00/7.48k [00:00<?, ?B/s]


solo_L2_epd-sis-a-hehist_20221113_V01.cdf:   0%|          | 0.00/7.08k [00:00<?, ?B/s]


solo_L2_epd-sis-a-hehist_20221114_V01.cdf:   0%|          | 0.00/7.63k [00:00<?, ?B/s]


solo_L2_epd-sis-a-hehist_20221115_V01.cdf:   0%|          | 0.00/7.16k [00:00<?, ?B/s]


solo_L2_epd-sis-a-hehist_20221112_V01.cdf:  11%|█         | 870/7.98k [00:00<00:01, 5.05kB/s]


Files Downloaded:  17%|█▋        | 1/6 [00:00<00:02,  2.04file/s]

solo_L2_epd-sis-a-hehist_20221111_V01.cdf:  14%|█▎        | 1.02k/7.48k [00:00<00:01, 5.88kB/s]


solo_L2_epd-sis-a-hehist_20221115_V01.cdf:  14%|█▍        | 1.02k/7.16k [00:00<00:01, 5.94kB/s]


solo_L2_epd-sis-a-hehist_20221113_V01.cdf:  14%|█▍        | 1.02k/7.08k [00:00<00:02, 2.19kB/s]


Files Downloaded:  67%|██████▋   | 4/6 [00:00<00:00,  5.77file/s]


solo_L2_epd-sis-a-hehist_20221114_V01.cdf:  11%|█▏        | 870/7.63k [00:00<00:03, 1.86kB/s]


solo_L2_epd-sis-a-hehist_20221116_V01.cdf:   0%|          | 0.00/6.44k [00:00<?, ?B/s]


solo_L2_epd-sis-a-hehist_20221116_V01.cdf:  14%|█▎        | 870/6.44k [00:00<00:01, 5.31kB/s]


Files Downloaded: 100%|██████████| 6/6 [00:00<00:00,  7.46file/s]
Files Downloaded: 100%|██████████| 6/6 [00:00<00:00,  6.29file/s]

 Loading file: /home/docs/sunpy/data/solo_L2_epd-sis-a-hehist_20221111_V01.cdf
/home/docs/checkouts/readthedocs.org/user_builds/solo-sis-loader/checkouts/latest/solo_sis_loader/__init__.py:222: UserWarning: Converting non-nanosecond precision datetime values to nanosecond precision. This behavior can eventually be relaxed in xarray, as it is an artifact from pandas which is now beginning to support non-nanosecond precision values. This warning is caused by passing non-nanosecond np.datetime64 or np.timedelta64 values to the DataArray or Variable constructor; it can be silenced by converting the values to nanosecond precision ahead of time.
  data_ = xr.Dataset(

 Loading file: /home/docs/sunpy/data/solo_L2_epd-sis-a-hehist_20221112_V01.cdf
/home/docs/checkouts/readthedocs.org/user_builds/solo-sis-loader/checkouts/latest/solo_sis_loader/__init__.py:222: UserWarning: Converting non-nanosecond precision datetime values to nanosecond precision. This behavior can eventually be relaxed in xarray, as it is an artifact from pandas which is now beginning to support non-nanosecond precision values. This warning is caused by passing non-nanosecond np.datetime64 or np.timedelta64 values to the DataArray or Variable constructor; it can be silenced by converting the values to nanosecond precision ahead of time.
  data_ = xr.Dataset(

 Loading file: /home/docs/sunpy/data/solo_L2_epd-sis-a-hehist_20221113_V01.cdf
/home/docs/checkouts/readthedocs.org/user_builds/solo-sis-loader/checkouts/latest/solo_sis_loader/__init__.py:222: UserWarning: Converting non-nanosecond precision datetime values to nanosecond precision. This behavior can eventually be relaxed in xarray, as it is an artifact from pandas which is now beginning to support non-nanosecond precision values. This warning is caused by passing non-nanosecond np.datetime64 or np.timedelta64 values to the DataArray or Variable constructor; it can be silenced by converting the values to nanosecond precision ahead of time.
  data_ = xr.Dataset(

 Loading file: /home/docs/sunpy/data/solo_L2_epd-sis-a-hehist_20221114_V01.cdf
/home/docs/checkouts/readthedocs.org/user_builds/solo-sis-loader/checkouts/latest/solo_sis_loader/__init__.py:222: UserWarning: Converting non-nanosecond precision datetime values to nanosecond precision. This behavior can eventually be relaxed in xarray, as it is an artifact from pandas which is now beginning to support non-nanosecond precision values. This warning is caused by passing non-nanosecond np.datetime64 or np.timedelta64 values to the DataArray or Variable constructor; it can be silenced by converting the values to nanosecond precision ahead of time.
  data_ = xr.Dataset(

 Loading file: /home/docs/sunpy/data/solo_L2_epd-sis-a-hehist_20221115_V01.cdf
/home/docs/checkouts/readthedocs.org/user_builds/solo-sis-loader/checkouts/latest/solo_sis_loader/__init__.py:222: UserWarning: Converting non-nanosecond precision datetime values to nanosecond precision. This behavior can eventually be relaxed in xarray, as it is an artifact from pandas which is now beginning to support non-nanosecond precision values. This warning is caused by passing non-nanosecond np.datetime64 or np.timedelta64 values to the DataArray or Variable constructor; it can be silenced by converting the values to nanosecond precision ahead of time.
  data_ = xr.Dataset(

 Loading file: /home/docs/sunpy/data/solo_L2_epd-sis-a-hehist_20221116_V01.cdf
/home/docs/checkouts/readthedocs.org/user_builds/solo-sis-loader/checkouts/latest/solo_sis_loader/__init__.py:222: UserWarning: Converting non-nanosecond precision datetime values to nanosecond precision. This behavior can eventually be relaxed in xarray, as it is an artifact from pandas which is now beginning to support non-nanosecond precision values. This warning is caused by passing non-nanosecond np.datetime64 or np.timedelta64 values to the DataArray or Variable constructor; it can be silenced by converting the values to nanosecond precision ahead of time.
  data_ = xr.Dataset(
fig, axis = plt.subplots(figsize=(6, 5), dpi=200)

sish.dataset.flux.plot.pcolormesh(x='time',
                                  cmap='turbo',
                                  add_colorbar=False,
                                  norm=colors.LogNorm(vmin=1, vmax=100),
                                  ax=axis)

axis.axhline(y=3.016029, linestyle='--', color='tab:red')
axis.axhline(y=4.002603, linestyle='--', color='tab:blue')

axis.set_xlim([datetime(2022, 11, 11), datetime(2022, 11, 16)])
axis.set_ylim([2, 5])

axis.set_yticklabels(axis.get_yticks(), rotation=90, va='center')

axis.set_ylabel('Mass (AMU)')
axis.set_xlabel('Time (UTC)')

axis.yaxis.minorticks_on()

axis.xaxis.set_major_locator(mdates.AutoDateLocator())
axis.xaxis.set_minor_locator(mdates.HourLocator())

plt.setp(axis.get_xticklabels(), rotation=0, ha='center')

axis.set_title('Helium mass spectrogram (SolO SIS-A, 0.5-2 MeV/nuc)')

fig.tight_layout()

plt.show()
/home/docs/checkouts/readthedocs.org/user_builds/solo-sis-loader/checkouts/latest/docs/source/examples/Basic_Plots/solo_sis_plot_histogram.py:48: UserWarning: set_ticklabels() should only be used with a fixed number of ticks, i.e. after set_ticks() or using a FixedLocator.
  axis.set_yticklabels(axis.get_yticks(), rotation=90, va='center')
Total running time of the script: (0 minutes 1.579 seconds)